

Flushing
Flushing is how data leaves MetricHouse and reaches your write function. Nothing flushes on its own. Something has to ask.
What a flush does
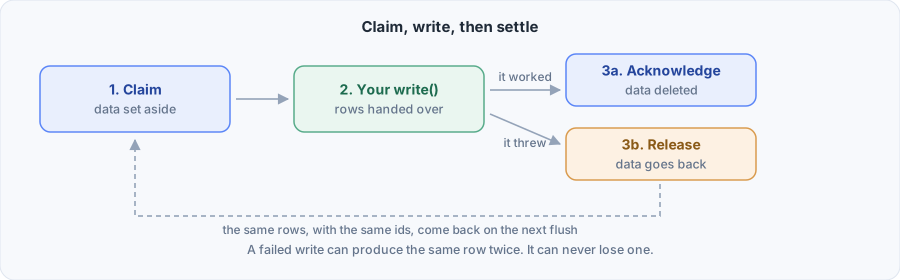
- Check the cadence. If this metric shipped recently, stop and report that it was skipped. On a shared driver such as
ioredis(), a shipment from any process counts, as Several processes on one driver explains. - Recover. Put back anything a previous flusher claimed and then died holding, so this flush can ship it. Almost always there is nothing to do, and on
memory()there is never anything to do. - Claim. Move everything eligible out of the live set. It is now invisible to live reads and to any other flush.
- Write. Turn the claim into rows and call your function.
- Settle. If your function returned, delete the claimed data. If it threw, put it back unchanged.
One claim is usually the whole flush. An event or a log with a claimLimit caps each claim, so a claim that comes back with exactly that many records is followed by another, and the flush stops at the first claim that carries fewer, or after a hundred claims.
Recovery comes before the claim on purpose. A claim that was abandoned is already out of the live set, so claiming can never find it however long you wait. See Recovering a crashed flush.
Three ways to ask
One metric
const report = await httpRequests.flush()
// { buckets: 6, rows: 42, skipped: false }
A metric is a complete unit. It knows its own cadence, its own write function and its own retry state, so flushing one needs no scheduler and no call to house.flush(). It does have to be bound, by passing it to createHouse({ schema }), because a metric that no house holds has no driver to claim from.
Every metric in a house
const report = await house.flush()
report.throwIfFailed()
This is a loop over metric.flush(). Each metric still honours its own cadence.
On a timer
house.start()One timer per metric, at that metric's own cadence, each starting at its own point in the interval. For a server that stays running.
The report
Both metric.flush() and house.flush() tell you what happened rather than throwing.
interface MetricFlushReport {
  buckets: number             // time windows in this batch
  rows: number                // rows handed to your write function
  skipped: boolean
  reason?: 'cadence' | 'not-selected'
  nextEligibleInMs?: number   // when the cadence will allow the next attempt
  error?: unknown             // set if your write function threw, or the claim failed
  written?: { buckets: number; rows: number }  // set beside error when earlier claims shipped
  releaseError?: unknown      // set if the write threw and putting the rows back failed too
  ackError?: unknown          // set if the rows shipped and settling the claim failed
  recovered?: RecoveryReport  // set if a dead flusher's batch was put back
  recoveryError?: unknown     // set if that repair failed. The flush still ran
}interface FlushReport {
ok: boolean // false if any metric failed
durationMs: number
metrics: Record<string, MetricFlushReport>
unmatched: string[] // names in only that matched no registered metric
throwIfFailed(): void
}A failure is reported rather than thrown because by the time your function has thrown, the claim has already been released. The data is safe. You are being told, not rescued.
recovered and recoveryError are about a different thing, and neither changes ok. error means your sink failed and this batch is going to be retried. recovered means an earlier flush died holding a batch and this one put it back. recoveryError means that repair failed, which delays the stranded batch and nothing else, so the flush underneath it still claims and still ships.
const report = await house.flush()

for (const [name, result] of Object.entries(report.metrics)) {
  if (result.error) {
    logger.error({ err: result.error, metric: name }, 'flush failed, will retry')
  }
}
Cadence is a floor
The flush setting is the fastest a metric is allowed to ship. Asking more often is harmless.
setInterval(() => house.flush(), 10_000)With flush: '5m' that is 30 calls that report skipped: true and one that ships. A call this process can rule out from its own last shipment is a clock comparison and nothing else. On a shared driver, a call it cannot rule out asks the driver, which is one round trip.
Ignore the cadence when you need to:
await httpRequests.flush({ force: true })    // ship everything closed, now
await house.flush({ force: true })
Use force on shutdown, in tests, and in an admin endpoint. Do not use it on your normal schedule, since the cadence is what keeps write volume predictable.
An empty flush does not use up the cadence
If a flush finds nothing to ship, the cadence clock is not advanced. Otherwise an early empty call would block the next real one for a full interval, which is worst on metrics with coarse resolutions.
A call that arrives up to a tenth of the cadence early counts as on time, so a metric on flush: '1m' ships on a call 54 seconds after its last shipment. The scheduler's timers and the house clock are two different clocks, and a tick can fire a millisecond before the clock says the interval is over. A cron fires wherever in its minute the platform gets to it, and one minute's call can come a few hundred milliseconds earlier than the last. Turning either away would make the metric wait a second full interval.
A flush that is still running counts as the latest shipment. A second call while the first is inside your write function reports skipped: true with reason: 'cadence', rather than claiming what closed since and shipping beside it in the same interval. If the first ships nothing, because nothing was closed or because your function threw, the next call goes ahead. When flushes overlap, a forced one beside a slow one, the cadence counts from the one started last, even when the slow one finishes after it.
The cadence is measured from the last flush that shipped rows. Before the first one there is nothing to measure from, so the first flush always goes ahead, whatever the clock reads. If the clock steps backwards, say an NTP correction of an hour, the next flush goes ahead too, instead of waiting for the clock to catch back up. It ships only the windows the stepped back clock says have closed. A write made after the step can land in a window ahead of the clock. It waits there until the clock passes that window again, unless a final flush on a driver such as memory() takes it first. A write that misses its window explains why, and where the write lands.
Several processes on one driver
With a driver every process can see, such as ioredis(), the cadence holds for the whole fleet. Every server runs the same code, and each metric still ships about once per flush interval between all of them. Two shipments without force are never closer together than nine tenths of the interval, the same tenth of slack a single process allows.
// on every server
house.start()
Before a flush claims anything, it takes the metric's turn from the driver. The driver records when the turn was taken, with a token unique to that turn, and refuses the next one until nine tenths of the interval has passed, whichever process asks. The last tenth is slack, so a cron that fires a little earlier within its minute than it did last time still gets the turn. A refused flush reports skipped: true with reason: 'cadence', and nextEligibleInMs says how long until nine tenths of the interval has passed since the turn the other process took.
// flush: '1m', and server A shipped 20 seconds ago
const report = await httpRequests.flush()      // on server B
// { buckets: 0, rows: 0, skipped: true, reason: 'cadence', nextEligibleInMs: 34_000 }
A flush that writes nothing gives its turn back, so another process can ship straight away. That covers a flush that found nothing closed and one whose write function threw. It gives back only the turn it took, matched by token, so a turn another flush took since is kept, even one taken in the same millisecond.
Each process keeping its own clock would let ten servers on flush: '1m' make up to ten small inserts a minute between them. The claim stops two of them shipping the same rows, and nothing else would stop each of them shipping a few. A columnar database such as ClickHouse writes each insert to disk as a separate part, and too many small ones is the load it handles worst.
What follows from how the turn works:
Whichever server asks first ships. Once the interval is over, the next flush from any server takes the turn and ships everything closed. One large insert per interval is what the database wants, so the work is left on one server rather than split into smaller inserts.
The turn uses each server's own clock. Servers whose clocks differ by a few milliseconds see the interval move by that much. A turn stamped by a clock running ahead, by less than nine tenths of an interval, holds the others back like any other. One further away than that is taken as a clock that stepped, and the flush goes ahead.
forceships regardless, and still records its turn, so the other servers count the interval from that shipment.A final flush waits for the turn too, when the driver is durable as well as shared. That is the flush
house.stop()makes. In a rolling deploy each stopping server would otherwise ship the few seconds since the last shipment, one small insert per server. What it leaves stays in Redis, and the next server to take the turn ships it, including one started by the deploy. If every server stops, the rows wait in Redis until one runs again. A process that knows it is the last one can ship them anyway:tsawait house.drain() await house.flush({ final: true, force: true }) // ignores the turn await house.stop()A locally staged event takes no turn. Its records sit in one process's memory, and only that process can ship them.
memory()takes no turn either. It serves one process, and the clock that process keeps is enough.
A flush that cannot reach the driver to take its turn reports the failure as its error, and claims nothing.
Only finished windows ship
A flush takes buckets that have ended and outlived their grace period. The bucket that is still filling stays where it is.
requests.add({ route: '/checkout' })
await requests.flush()
// { buckets: 0, rows: 0, skipped: false }   the minute has not ended yet
This is not a bug. Shipping a window before it finishes sends a partial value, and a later send under the same row id would either overwrite it or duplicate it, depending on your table. If you want that behaviour deliberately, that is immediate delivery.
Events and logs are different. A record is complete the moment you write it, so there is no partial state to protect and a flush takes the whole backlog, in claims of at most claimLimit records each when the event sets one.
Using the scheduler
house.start()What it does:
- Creates one interval per metric, at that metric's
flushMs. - Starts each metric at its own point in the interval, so a server's metrics do not all send their inserts in the same second. The point comes from a hash of the metric's name, so it is the same after a restart and on every server. A metric's first tick fires within one interval of
start(), then once per interval from there. - Skips a tick if the previous one for that metric has not finished, so a slow database does not stack writes on top of each other.
- Sends failures to
onError, since a scheduled flush has no caller to return a report to. A failed recovery pass goes there too, as itsrecoveryError, although the flush below it still ran, and so do areleaseErrorand anackError. With noonError, each becomes an unhandled rejection, except therecoveryErrorof a locally staged event that could not ask its driver for records an earlier declaration left there, which is dropped. The next interval asks again, and nothing was lost. - Arms a second timer for each gauge and level declared with
collect, which calls it a little before each window ends. See Collecting before a window closes. - Unreferences its timers, so metrics never keep your process alive.
- Picks up metrics registered after it started.
house.running     // true
house.start()     // calling again does nothing
Stopping cleanly
await house.stop()Clears the timers, waits for every flush and every collect still running, then drains writes still on their way to the driver and waits for flushes again, and keeps taking those two turns until a wait for flushes that follows a drain finds none. Then it calls collect once on every gauge and level that declares it, unless it has already run for the window that is open, and drains what that wrote. Then it makes a final flush: past this process's cadence, and past grace, so on a driver of its own every window that has ended ships. On a shared, durable driver such as ioredis(), the final flush still waits for the turn. A metric another process took the turn for reports skipped: true and ships nothing, and its rows stay in Redis for whichever process takes the next turn. It returns the report from that final flush. A second call while the first is still running returns the same promise, unless house.start() ran in between.
Waiting for a running flush matters. If its write function fails after stop() was called, the rows go back to the driver, and the final flush is what ships them. That holds for every flush, whoever started it: a scheduler tick, a cron calling house.flush(), or a direct metric.flush(), including one that starts while stop() is waiting for flushes or for writes. A house.flush() flushes its metrics one at a time, and stop() waits until it has finished the last of them. A sink that never returns keeps stop() waiting, so give it a timeout.
process.on('SIGTERM', async () => {
  server.close()
  const report = await house.stop()
  if (!report.ok) logger.error({ report }, 'final flush failed')

  // skipped on the turn is not a failure. Those rows wait in Redis for the
  // process that takes the next turn, and on memory() nothing is skipped
  const waiting = Object.entries(report.metrics)
    .filter(([, metric]) => metric.skipped)
    .map(([name]) => name)
  if (waiting.length > 0) logger.info({ waiting }, 'left for the next turn')

  process.exit(0)
})
report.ok is false when a metric's write function threw during the final flush. On a durable driver those rows are back in storage for the next process, and on memory() they go when the process exits.
Collecting before a window closes
A gauge or a level declared with collect reads its value from somewhere else, such as a list length in your own Redis, rather than waiting for your code to write it. The metric pages show the declaration. This section covers when the function runs.
| What calls it | When |
|---|---|
The scheduler, after house.start() | collectLead before each window of the metric ends |
metric.flush() or house.flush(), while the scheduler is not running | First, before the cadence check |
house.stop() | Once, after the running flushes and writes have settled and before the final flush |
Whatever calls it, collect runs at most once per window in each process. A window a flush has already collected is not collected again by the timer or by stop(), and a second flush inside the same window does not call it. A clock that steps back into an earlier window collects again straight away, rather than waiting to catch up.
A flush made while the scheduler is running leaves collect to the timer, which runs closer to the end of the window. A final flush never calls it, because house.stop() has called it already and drained what it wrote.
Where the readings land
collect calls set() like any other code, and a write lands in the window that is open at that moment.
- On the timer, that is the window about to close, provided
collectfinishes inside the lead. A read slower than the lead lands in the next window, so givecollectLeadroom for it. - From a flush, it is the window open when the flush started. That flush ships only windows that have closed, so the reading ships with a later flush. A cron calling
house.flush()once a minute therefore collects once a minute, at whatever point in the window the cron fires. - From
house.stop(), it is the window still open, which a stopping process cannot ship. On a shared, durable driver it stays in storage for the process that takes the next turn. Onmemory()it ends with the process, like any other write to that window.
The timer is set again after every run, from the clock, rather than repeating at a fixed interval, so a run that takes a while does not push later ones off the window boundary. Started inside the lead, the scheduler waits for the next window.
When it fails or runs long
- A
collectthat throws or rejects goes toonErrorwith the metric's name, and with noonErrorit becomes an unhandled rejection, as a failed write does. It never stops a flush, and the flush report does not mention it. - A
collectstill running when the next one is due is left running, and the one that was due is skipped rather than started beside it. drain()andhouse.stop()wait for acollectstill running, and for the writes it makes. Acollectthat never returns keeps both waiting, so give the read inside it a timeout. For the same reason,collectmust not awaitdrain()orstop()itself, because each would wait for thecollectthat is waiting for it.house.stop()clears the timers, and nocollectruns on a timer after it returns.
Collecting across a fleet
With collectScope: 'fleet', the default, on a driver that is shared, such as ioredis(), one process per window runs collect. Before it calls the function, a process takes a turn from the driver, with the same takeTurn a flush uses but under a key of its own, the metric name followed by :collect. No metric name can hold a colon, so that key never belongs to a real metric. On Redis it is mh:turn:<metric>:collect, beside the metric's flush turn.
The turn is stamped with the start of the window rather than the time, and the gap is one resolution. Every process asks about the same window at about the same moment, by its own clock, so the first to ask is granted and every other is refused and skips that window. A clock that is off by less than a window still names the same window, so it changes which process collects and nothing else. The turn is never given back, so a collect that fails leaves that window without a reading rather than letting a second process try. A turn the driver cannot give, because Redis is unreachable, goes to onError, and that process skips the window.
With collectScope: 'process', no turn is taken and every process runs collect every window. On a driver that is not shared, such as memory(), there is nobody to take turns with, and the two scopes are the same.
'fleet' | 'process' | |
|---|---|---|
| Calls per window, with N processes | 1 | N |
| A gauge's window | one observation | N observations, folded into min, max, sum and count |
| A level's window | the value one process read | the value the last process to write set |
| Right for | a value every process reads the same, such as a queue in shared Redis | a value each process has its own of, such as its heap, with an instance dim |
Flushing without a long running process
On serverless and edge platforms, timers inside a frozen process never fire. Pump it from outside.
// app/api/cron/flush/route.ts
import { house } from '@/metrics/house'

export async function GET() {
  const report = await house.flush()
  return Response.json({ ok: report.ok, metrics: report.metrics })
}export default {
async scheduled(_event, _env, ctx) {
ctx.waitUntil(house.flush())
},
async fetch(request, _env, ctx) {
const response = await handle(request)
ctx.waitUntil(house.drain()) // make sure writes reached the driver
return response
},
}export const handler = async (event) => {
const response = await handle(event)
await house.drain() // before the runtime freezes
return response
}
// A separate scheduled function, on an EventBridge rule
export const flushHandler = async () => {
const report = await house.flush()
if (!report.ok) throw new Error('flush failed')
}Two separate things are happening here, and both are needed:
drain()on every request makes sure the writes you just made reached the driver before the process freezes.flush()on a schedule moves finished windows out of the driver and into your database.
With the memory driver on serverless, drain() is not enough, because the data is inside an isolate that may never run again. Use a shared driver such as ioredis(). Immediate delivery also gets the rows out, but each isolate then sends its own running total, so only events and logs stay exact. See Deployment targets.
In production
A worker loop that flushes and reports its own health:
import { house } from './metrics/house.js'
import { logger } from './logger.js'

let consecutiveFailures = 0

async function pump() {
  try {
    const report = await house.flush()

    if (report.ok) {
      consecutiveFailures = 0
    } else {
      consecutiveFailures += 1
      const failed = Object.entries(report.metrics)
        .filter(([, r]) => r.error)
        .map(([name]) => name)

      logger.error({ failed, consecutiveFailures }, 'flush failed, data retained')

      if (consecutiveFailures >= 10) {
        await pageOnCall('metric flush failing for 10 consecutive attempts')
      }
    }
  } catch (error) {
    // Paging failed. A driver that cannot be reached is not caught here: it
    // arrives as that metric's report.error, and counts as a failed flush above.
    logger.error({ err: error }, 'could not page on call')
  }
}

setInterval(pump, 10_000)
Nothing is lost while your database is down. Data stays in the driver and ships when it recovers. What you do need to watch is the driver filling up, which is what event.pending() and the memory driver's limits are for. See Reliability.