

gauge
A gauge records values you sample. Where a counter asks "how many times", a gauge asks "what was it when we looked".
import { gauge, oneOf } from 'metrichouse/core'

export const onlineUsers = gauge('online_users', {
  dims: { region: oneOf(['us-east', 'eu-west', 'ap-south']) },
  resolution: '1m',
  flush: '1m',
  write: async (rows) => clickhouse.insert({ table: 'online_users', values: rows }),
})onlineUsers.set(1_284, { region: 'us-east' })Use it for
Users online, queue depth, connection pool size, cache hit ratio, temperature, disk usage, memory in use. Anything that has a value at a moment in time.
What it keeps
Every observation in a window folds into five numbers.
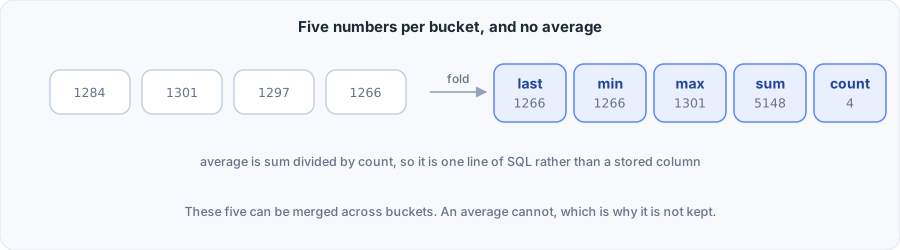
| Column | Meaning |
|---|---|
last | The most recent value observed in this window |
min | The smallest |
max | The largest |
sum | Every value added together |
count | How many observations there were |
Why there is no average
These five can be merged across windows. An average cannot.
If one minute has an average of 10 and the next has an average of 20, the average across both minutes is not 15 unless both had the same number of observations. Storing an average would produce wrong numbers the moment anyone grouped by hour.
sum and count do merge, and sum / count gives the exact average whenever you want it:
SELECT
  toStartOfHour(bucket_ts) AS hour,
  region,
  sum(sum) / sum(count) AS avg_online,
  min(min)              AS lowest,
  max(max)              AS highest
FROM online_users
GROUP BY hour, region;
That is the whole reason the five are what they are.
Try the fold
Drag the observations. Everything below them is what MetricHouse keeps, and the average line is the one number it refuses to store.
Try it: what one bucket folds to
Drag each observation. These are 4 observations inside one bucket, and the five numbers below are everything MetricHouse keeps about them.
{ id: '4f2c18a6…', bucket_ts: Date, region: 'us-east', last: 1,266, min: 640, max: 1,301, sum: 4,187, count: 4 } Average is sum / count = 1046.8, computed in SQL. It is not stored because an average cannot be merged across buckets.
Turn sum or count off and the average becomes unrecoverable. That is the whole argument for keeping both.
Writing
onlineUsers.set(1_284, { region: 'us-east' })
onlineUsers.set(1_301, { region: 'us-east' })
onlineUsers.set(1_297, { region: 'us-east' })

// The window now holds:
// { last: 1297, min: 1284, max: 1301, sum: 3882, count: 3 }
set() records an observation. It does not replace a previous one. Several observations in the same window all contribute to the fold.
For a gauge with no dimensions the argument is optional:
const queueDepth = gauge('queue_depth', { resolution: '10s', flush: '1m', write })
queueDepth.set(42)
Reading
// One series, from the window still filling.
await onlineUsers.current({ region: 'us-east' })
// { last: 1297, min: 1284, max: 1301, sum: 3882, count: 3 }
// undefined if nothing has been observed in this window

// Every region merged.
await onlineUsers.totals()
// { min: 612, max: 1301, sum: 7284, count: 6 }
current() returns undefined rather than a zeroed object when nothing has been observed, because a min of 0 for a gauge nobody wrote to is a lie and a chart should show a gap.
totals() has no last. With several regions there is no single latest observation, and inventing a rule for one would be the same mistake as storing an average.
await onlineUsers.snapshot()
await onlineUsers.snapshot({ dims: { region: 'us-east' } })
await onlineUsers.snapshot({ rollup: 'sum', groupBy: ['region'] })
A rollup merges folds the way the five aggregates merge: sum and count add, min and max take the extreme, last takes the latest in window order.
The rows you receive
{
  id: '...',
  bucket_ts: Date,
  region: 'us-east',
  last: 1297,
  min: 1284,
  max: 1301,
  sum: 3882,
  count: 3,
}CREATE TABLE online_users (
id String,
bucket_ts DateTime64(3),
region LowCardinality(String),
last Float64,
min Float64,
max Float64,
sum Float64,
count Int64
)
ENGINE = ReplacingMergeTree
ORDER BY (bucket_ts, region);CREATE TABLE online_users (
id TEXT PRIMARY KEY,
bucket_ts TIMESTAMPTZ NOT NULL,
region TEXT NOT NULL,
last DOUBLE PRECISION NOT NULL,
min DOUBLE PRECISION NOT NULL,
max DOUBLE PRECISION NOT NULL,
sum DOUBLE PRECISION NOT NULL,
count BIGINT NOT NULL
);Storing fewer columns
Ask for only the aggregates you will query.
const cacheHitRatio = gauge('cache_hit_ratio', {
  aggregate: ['sum', 'count'],     // enough to compute an average
  resolution: '1m',
  flush: '1m',
  write,
})
All five are always folded internally. The saving is columns written, not work done, which means widening this later needs no migration of anything already in flight.
Settings
| Setting | Type | Default | Meaning |
|---|---|---|---|
dims | shape | none | Labels to break the value down by |
resolution | duration | required | How wide one window is |
flush | duration | house default | The fastest this may ship |
grace | duration | '2s' | How long a late observation may still land |
aggregate | array | all five | Which columns reach your sink |
write | function | required | Where the rows go |
Tune it
A gauge buckets exactly like a counter, so the same two settings decide the same things. The difference is that each row carries five columns rather than one.
Try it: resolution inside flush
The declaration these settings produce
gauge('online_users', {
  resolution: '1m',
  flush: '1m',
  write: async (rows) => db.insert(rows),
})
Your sink receives id, bucket_ts, …dims, min, max, sum, count, one row per combination per bucket.
A gauge is not a level
A gauge answers "what values were observed in this window". A window with no observations is absent, which on a chart is a gap rather than a held line.
That is right for something you sample. It is wrong for a quantity that persists between observations, such as queue depth, where "no observation" means the value did not change rather than that it stopped existing.
A dedicated metric for that is planned but not built. Today, sample on a fixed timer so every window has at least one observation:
setInterval(() => {
  queueDepth.set(queue.size())
}, 10_000)
With resolution: '1m' that gives six observations a minute, and no window is ever empty.
In production
System health sampled on a timer.
// metrics/schema.ts
import { gauge, oneOf, str } from 'metrichouse/core'
import { toClickHouse } from './sinks.js'

export const systemHealth = gauge('system_health', {
  dims: {
    metric: oneOf(['heap_used_mb', 'rss_mb', 'event_loop_lag_ms', 'db_pool_in_use']),
    instance: str(),
  },

  // One row per minute per measurement, which is plenty for capacity work.
  resolution: '1m',
  flush: '1m',

  write: toClickHouse('system_health'),
})// metrics/sampler.ts
import { monitorEventLoopDelay } from 'node:perf_hooks'
import { systemHealth } from './schema.js'
import { pool } from '../db.js'
const instance = process.env.HOSTNAME ?? 'local'
const loopDelay = monitorEventLoopDelay({ resolution: 10 })
loopDelay.enable()
export function startSampling() {
// Every ten seconds gives six observations per minute, so min and max are
// meaningful and no window is ever empty.
const handle = setInterval(() => {
const memory = process.memoryUsage()
systemHealth.set(memory.heapUsed / 1024 / 1024, { metric: 'heap_used_mb', instance })
systemHealth.set(memory.rss / 1024 / 1024, { metric: 'rss_mb', instance })
systemHealth.set(loopDelay.mean / 1e6, { metric: 'event_loop_lag_ms', instance })
systemHealth.set(pool.numUsed(), { metric: 'db_pool_in_use', instance })
loopDelay.reset()
}, 10_000)
// Sampling should never be the reason the process stays alive.
handle.unref()
return () => clearInterval(handle)
}-- The worst event loop lag per instance, per hour.
SELECT
toStartOfHour(bucket_ts) AS hour,
instance,
max(max) AS worst_lag_ms,
sum(sum) / sum(count) AS avg_lag_ms
FROM system_health
WHERE metric = 'event_loop_lag_ms'
AND bucket_ts >= now() - INTERVAL 1 DAY
GROUP BY hour, instance
ORDER BY worst_lag_ms DESC;Live capacity checks
Because the fold is readable before it ships, a gauge can drive a decision.
export async function shouldShedLoad() {
  const lag = await systemHealth.current({ metric: 'event_loop_lag_ms', instance })

  // No observation yet in this window, so no reason to act.
  if (!lag) return false

  return lag.max > 250
}