

Reading live data
You can ask a metric what it holds right now, before anything has reached your database. This is how you build a live dashboard, a health endpoint, or a decision that depends on the last few seconds of traffic.
There are two calls. current() answers one simple question. snapshot() gives you rows.
current: the quick answer
await pageViews.current({ path: '/pricing' })   // 42
await pageViews.current()                       // every path added together
For a counter, current() returns a number from the window that is still filling. With dimension values it returns that one series. Without them it returns the metric's total across every series.
An unseen series returns 0 rather than undefined, because a dashboard should render a zero rather than a gap.
Each metric type answers slightly differently:
await pageViews.current({ path: '/pricing' })   // 42
await pageViews.current() // 137, every series summedawait onlineUsers.current({ region: 'us-east' })
// { last: 1266, min: 1266, max: 1301, sum: 5148, count: 4 }
// undefined if nothing has been observed in this window
await onlineUsers.totals()
// { min: 612, max: 1301, sum: 7284, count: 6 }
// every region merged. No `last`, because there is no single latest value.await httpLatency.current({ route: '/checkout' })
// { last: 34.2, min: 12.4, max: 3400.2, sum: 5012.9, count: 18 }
await httpLatency.totals()await signups.pending() // 128 records staged and not yet shipped
await signups.peek(5) // the first 5 as rows, without consuming themsnapshot: everything unshipped
current() only sees the window that is still filling. snapshot() sees everything still in the driver, including finished windows that have not been flushed yet. On a metric with a five minute cadence, that is most of the recent history.
const rows = await pageViews.snapshot()
// [
//   { id: '...', bucket_ts: Date, path: '/pricing', value: 12,
//     bucket_open: false, bucket_elapsed_ms: 60000 },
//   ...
// ]
Rows carry the same columns your write function would receive, plus two extra fields that say how finished each row is.
| Field | Meaning |
|---|---|
bucket_open | Is this window still accepting writes |
bucket_elapsed_ms | How many milliseconds of the window have passed |
The open window is excluded by default
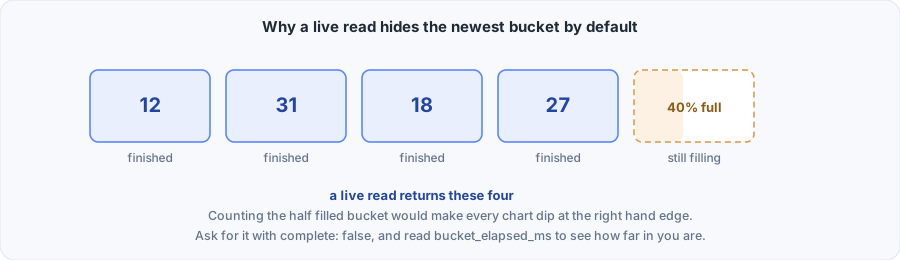
If you poll a ten second counter at a random moment, the current window is on average half full. Included in a chart, it makes every series dip at the right hand edge, and as a rate it produces a sawtooth that looks like a real traffic pattern.
So complete defaults to true and the open window is left out. Ask for it explicitly when you want it, and use bucket_elapsed_ms to scale it:
const rows = await pageViews.snapshot({ complete: false })

for (const row of rows) {
  if (row.bucket_open) {
    const fraction = row.bucket_elapsed_ms / pageViews.resolutionMs
    console.log('projected', (row.value as number) / fraction)
  }
}
Options
await pageViews.snapshot({
  dims: { path: '/pricing' },   // partial match on declared dimensions
  from: Date.now() - 300_000,   // lower bound on bucket_ts, inclusive
  to: Date.now(),               // upper bound, exclusive
  complete: true,               // exclude the window still filling
  rollup: 'none',               // 'none' keeps one row per window, 'sum' merges
  groupBy: ['path'],            // collapse to these dimensions
  orderBy: 'value',             // sort before limit, so limit means top K
  direction: 'desc',
  limit: 10,
})
Every option, what each metric type does with it, and the errors they raise are in Snapshot options.
Common shapes
// A chart: one point per window, one line per series.
await httpRequests.snapshot({
  from: Date.now() - 600_000,
  orderBy: 'bucket_ts',
  direction: 'asc',
})

// The top ten routes over everything unshipped.
await httpRequests.snapshot({
  rollup: 'sum',
  groupBy: ['route'],
  orderBy: 'value',
  limit: 10,
})

// One series, in detail.
await httpRequests.snapshot({ dims: { route: '/checkout' } })
What a rollup drops
rollup: 'sum' merges every window of a series into one row, so bucket_ts and id are dropped. Neither survives a merge, because there is no longer one window for them to name. A groupBy keeps windows, so bucket_ts survives and id is kept only where the grouping happened to merge nothing.
Types follow the options
Rows are typed to the metric that produced them, and the row type changes with the options you pass.
const rows = await httpRequests.snapshot()
rows[0].route      // string
rows[0].status     // '2xx' | '4xx' | '5xx'

const rolled = await httpRequests.snapshot({ rollup: 'sum' })
rolled[0].bucket_ts
//        ^^^^^^^^^ Type error: this row has no bucket_ts
Pass the options object inline for this to work. How the type changes with the options explains why a variable typed as SnapshotOptions gives you the unrolled shape.
Across a whole house
const snap = await house.snapshot()
snap.http_requests    // LiveRow[]
snap.app_log          // LiveRow[]

await house.snapshot({ only: ['http_requests'], rollup: 'sum' })
Metrics are read in parallel. Options that only make sense for a folded metric are ignored by events and logs rather than rejected, so one set of options works across a mixed schema.
const now = await house.current()house.current() reads only the window still filling, and only for folded metrics. Events and logs are absent from the result, because they have no open window. That is deliberate: present and empty would read as "nothing is happening" instead of "wrong question".
What a live read cannot do
- It does not see your database. Only what is still held in the driver.
- It does not see claimed data. A flush in progress has moved its data out of view until the write settles.
- It cannot give you percentiles. A gauge holds five numbers, not the individual values. If you need p95 for the current window, record the values to an event as well and query those.
- It only sees this process on the memory driver. With
memory(), each server has its own totals. Useioredis()if you want one shared answer across a fleet.
In production
A live dashboard endpoint:
app.get('/internal/live', async (_req, res) => {
  const [requests, latency, online] = await Promise.all([
    httpRequests.snapshot({
      from: Date.now() - 300_000,
      rollup: 'sum',
      groupBy: ['route'],
      orderBy: 'value',
      direction: 'desc',
      limit: 20,
    }),
    httpLatency.snapshot({ rollup: 'sum', groupBy: ['route'] }),
    onlineUsers.totals(),
  ])

  res.json({ requests, latency, online })
})
A rate limit decision that needs the last few seconds and cannot wait for a flush:
const perTenantRequests = counter('tenant_requests', {
  dims: { tenantId: str() },
  resolution: '1s',
  flush: '1m',
  write: toClickHouse('tenant_requests'),
})

async function overQuota(tenantId: string) {
  const inThisSecond = await perTenantRequests.current({ tenantId })
  return inThisSecond > 50
}
With memory() that counts one server. With ioredis() it counts the whole fleet, which is usually what a quota means.
Stitching live rows onto history from your database:
const historic = await clickhouse.query(`
  SELECT bucket_ts, route, sum(value) AS value
  FROM http_requests
  WHERE bucket_ts >= now() - INTERVAL 1 HOUR
  GROUP BY bucket_ts, route
`)

const live = await httpRequests.snapshot({ from: Date.now() - 3_600_000 })

// Live rows carry the same id and bucket_ts your sink would write, so you can
// tell when the two sets describe the same row rather than double counting.