

Choosing a metric type
There are five. Pick by the question you want to answer later.
| Type | Answers | Storage |
|---|---|---|
counter | How many times did this happen | Folded |
gauge | What was this value when we looked | Folded |
event | What exactly happened, with all the detail | Kept whole |
log | What did the application say, and how serious was it | Kept whole |
timer | How long did this take | Folded |
A decision guide
Are you tallying occurrences? Use a counter. Requests served, errors, signups, emails sent, bytes transferred, money taken.
Are you sampling a value that exists whether or not you look? Use a gauge. Users online, queue depth, cache hit ratio, temperature, disk usage.
Are you measuring how long something took? Use a timer. It is a gauge with the clock handling built in.
Do you need per item detail you cannot label? Use an event. A user id, a request id, a free text note, a JSON payload. Anything unique per occurrence.
Are you writing application messages with a severity? Use a log. It is an event with a level, a filter and a bound child logger.
Folded against kept whole
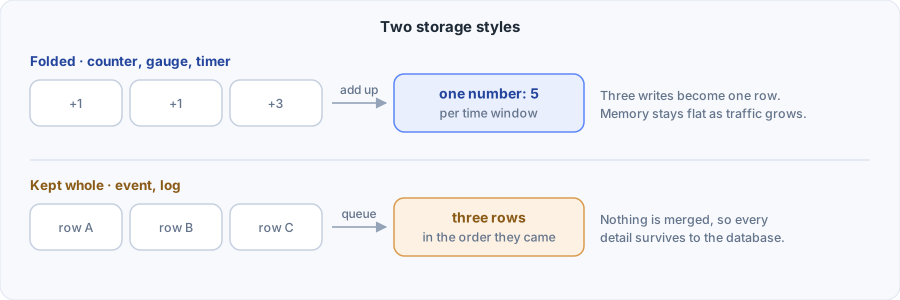
Folded metrics combine writes into one value per time window. Memory use depends on how many label combinations you have, not on how much traffic you get. A thousand increments in one second become one row.
Kept whole metrics keep every record. Memory use grows with traffic until the records ship, which is why they have batching settings and a backlog you can query.
requests.storage   // 'bucketed'
signups.storage    // 'staged'
Using two together
Counters and events are complementary, and the common pattern is to write both.
const checkouts = counter('checkouts', {
  dims: { plan: oneOf(['free', 'pro', 'team']), outcome: oneOf(['paid', 'failed']) },
  resolution: '1m',
  flush: '1m',
  write: toClickHouse('checkouts'),
})

const checkoutAttempted = event('checkout_attempted', {
  fields: {
    userId: str(),
    plan: oneOf(['free', 'pro', 'team']),
    outcome: oneOf(['paid', 'failed']),
    amountCents: int(),
    failureReason: str().optional(),
  },
  flush: '1m',

  // Every event also increments the counter. No second write path to forget.
  derive: {
    checkouts: (fields) => ({ dims: { plan: fields.plan, outcome: fields.outcome } }),
  },

  write: toClickHouse('checkout_attempted'),
})
The counter stays small and is fast to query for charts. The event holds the detail you need when a number looks wrong. derive keeps them consistent, and runs before sampling, so the counter stays exact even when the event table only keeps a slice.
Things that are deliberately missing
No histogram. Percentiles are a query over rows you already have. Record the values to an event and write quantile(0.95)(duration_ms).
No average on a gauge. It stores sum and count. An average cannot be merged across windows, so storing it would produce wrong numbers when two windows are combined. sum / count is exact and one division away.
No set and no distinct. Counting unique users is not implemented yet. Record a userId to an event and use uniq() in your query.
No level metric. A gauge answers "what values were observed in this window". A window with no observations is absent, which on a chart is a gap rather than a held line. A metric for a quantity that persists between observations, such as queue depth, is planned but not built. Today, sample it on a timer and write a gauge.
Shared settings
Every metric type takes these.
| Setting | Applies to | Meaning |
|---|---|---|
write | All | The function that receives rows. Required |
flush | All | The fastest this metric may ship |
dims | counter, gauge, timer | Labels to break the number down by |
fields | event, log | The record schema. json() is allowed here |
resolution | counter, gauge, timer | How wide one time window is. Required |
grace | counter, gauge, timer | How long a late write may still land. Default '2s' |
stage | event, log | Where records wait. 'driver' or 'local' |
batch | event, log | Local staging only. Size and age limits |
And every metric exposes these.
metric.name
metric.kind          // 'counter' | 'gauge' | 'event' | 'log' | 'timer'
metric.storage       // 'bucketed' | 'staged'
metric.flushMs
metric.isBound
metric.rowShape()    // the exact columns your sink will receive
metric.snapshot()    // unshipped rows
metric.flush()       // ship now, if the cadence allows
metric.drain()       // wait for queued writes to reach the driver