

What MetricHouse is
MetricHouse is a TypeScript library for recording things that happen in your application: how many requests arrived, how many users were online, which events occurred, how long each operation took.
It does three jobs:
- It accepts writes cheaply, so measuring something does not slow it down.
- It groups those writes into time windows and keeps running totals.
- It hands you finished rows on a schedule you choose.
It does not store the rows. It has no query language, no dashboard and no database driver. You supply a function, MetricHouse calls it with an array of plain objects, and what happens next is yours.
Why it exists
MetricHouse started from a frustration that came back with every new business and every new website. You want to count a few things, such as signups, page views or how long checkout takes. Then you look at the tools that do it, and each one asks you to adopt a stack of its own first: a hosted backend, a collector service, a monitoring server or a database cluster.
Those tools are designed to be chosen early, before the rest of the system. When your application already exists, fitting one in means reshaping the application around it.
MetricHouse fits into the stack you already have. You call add() wherever something happens. MetricHouse collects those calls, groups them into time windows (one minute each, say) and keeps a running total for each window. When it is time to write, it passes your function an array of plain rows, and you store them however your storage needs: an insert into Postgres, a file in S3, or a request to an API.
You keep the most important part: how the data is written, where it lives, and what you do with it afterwards.
What existing tools ask of you
Most analytics and metrics tools fall into three groups. Each is good at the job it was designed for, and each asks you to build around it in its own way.
Hosted analytics
Google Analytics, Mixpanel, Amplitude and PostHog Cloud collect your events into their own storage. You read the results back through their website or their API.
Your data lives in their database. Copying it into your own is an export job that runs on a schedule. PostHog's batch exports run every five minutes at the most frequent.
Collection usually happens in the visitor's browser, through a script loaded from the vendor's domain. Content blockers such as uBlock Origin block those scripts, and uBlock Origin blocks Google Analytics by default, so some of your visitors never appear in the numbers.
The numbers also arrive late. Google says GA4 processing can take 24 to 48 hours. Its realtime report covers only the last 30 minutes, with a smaller set of dimensions (the labels you can break a number down by, such as country or page).
Self hosted analytics
PostHog and Plausible can also run on your own servers. The data stays with you, and in exchange you run their infrastructure.
PostHog's self hosted deployment runs six services beside the application: Postgres, ClickHouse (a database built for analytics queries), Redis, Kafka (a message queue), Zookeeper (which coordinates Kafka) and MinIO (file storage). It asks for a machine with 4 CPUs and 16GB of memory.
Plausible's Community Edition needs Docker and ClickHouse, at least 2GB of memory, and a processor that supports the SSE 4.2 or NEON instruction sets.
Either one is a second system to install, upgrade and back up, next to the one you are building.
Observability libraries
OpenTelemetry and the Prometheus client for Node are libraries you add to your code. Each one expects a pipeline of other services around it.
OpenTelemetry's Node guide installs five packages and uses a Node command line flag to load a setup file before your application starts. Your measurements then travel through an exporter (the component that sends them out) to a collector (a separate service that receives them) or to a monitoring backend.
Prometheus collects by pulling, which it calls scraping. Each of your processes serves a web page listing its current values, and a Prometheus server reads that page on a schedule. A serverless function only runs while it handles a request, so there is rarely a page left for Prometheus to read. For short jobs Prometheus offers the Pushgateway, which stores the last values each job pushed. Adding counts together across many instances is left to you.
Reading the numbers right now
All three groups share one gap. Your own code has no easy way to ask a plain question such as "how many signups so far this minute?"
In OpenTelemetry, your code can write to a counter and cannot read it back. The value only leaves through a reader and an exporter. With the Prometheus client, each process holds only its own share of the count, so a total across servers means querying the Prometheus server, and the answer is as fresh as its last scrape. Hosted tools answer through their own dashboards once their processing has finished.
So a live counter on your site, a quota check or a health endpoint needs a second layer built beside your analytics, and several servers then need to agree on the numbers in that layer too.
What MetricHouse does instead
MetricHouse keeps its running totals in a driver. The memory() driver holds them inside your process. The ioredis() driver holds them in a Redis server you run, so every instance of your application adds to and reads from the same totals.
| What existing tools ask | What MetricHouse does |
|---|---|
| Be chosen first, with the stack built around them | Imports into the stack you already have, with no runtime dependencies |
| A backend, a collector or a database cluster to run | Runs inside your process. Redis is the one service it can use, when you want totals shared across servers |
| Your data kept in their storage, in their shape | Calls your write function with plain rows, and you choose the table, file or API |
| Live numbers that arrive late, or only in their dashboard | current() and snapshot() read the window that is still filling, from your own code |
| Several servers added up somewhere else | The ioredis() driver keeps one shared set of totals for every instance |
| A long running process to scrape, or a collector to push to | house.start() flushes on a server, and a cron or a request handler calls house.flush() on serverless |
| A browser script that extensions can block | You call it from your server code, so nothing runs in the browser |
What you would otherwise write yourself
Once storage is yours, the tempting shortcut is one database row per page view. That works until traffic grows, and then you are inserting millions of rows to answer a question about a few thousand numbers.
The better approach is to count in memory and write one row per page per minute. That is a small amount of code, and it is very easy to get wrong:
- Where exactly does a minute start and end?
- What happens to a write that arrives a few milliseconds after the minute ends?
- What happens if the database is down when you try to write?
- How do you avoid writing the same minute twice after a retry?
- How do two servers agree on the same minute?
MetricHouse is that small amount of code, written carefully, with those five questions answered.
Buckets and time works through this trade in full: what a summarised row looks like in your table, what it costs you, and how to pick the settings that control it.
How it decides what to include
Some work can only happen at the moment a write arrives. Adding an increment to the right minute is one example: once the increment is thrown away, nothing can rebuild it. Other work can happen later, in any query over rows you kept, such as an average or a percentile. MetricHouse does the first kind of work and leaves the second kind to your database. That split keeps the library small, and it settles questions like these:
| Question | Answer | Why |
|---|---|---|
| Is there a counter? | Yes | Increments you throw away are gone. Nothing can rebuild them. |
| Is there a histogram? | No | Percentiles are a SELECT over rows you already kept. |
| Does a gauge store an average? | No | It stores sum and count. Average is one division in SQL. |
| Is there a query engine? | No | Your database already has one. |
| Does it write SQL? | No | Your table is yours to design and migrate. |
What you are responsible for
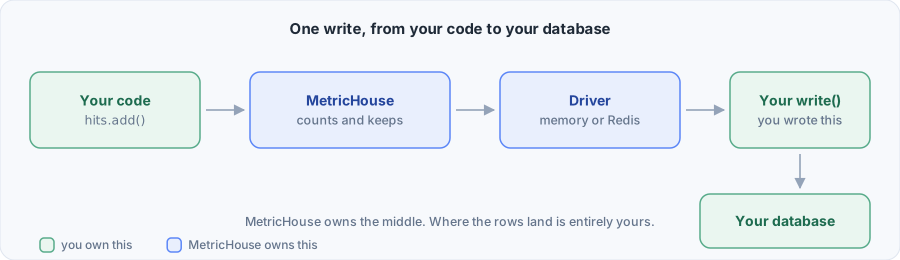
| MetricHouse handles | You handle |
|---|---|
| Deciding which time window a write belongs to | Creating the table |
| Adding up values safely when many writes arrive at once | Writing the insert |
| Holding data until you ask for it | Deciding how often to ask |
| Giving every row a stable id | Deciding whether your table treats that id as unique |
| Retrying rows whose write failed | Reporting or alerting on repeated failures |
When to use something else
MetricHouse is a good fit when you already have somewhere to put the data, such as ClickHouse, Postgres, BigQuery, S3 or a log pipeline, and you want clean rows to put in it without changing your stack to get them.
It is not a good fit if you want a finished product. If you want dashboards, funnels, alert rules and a hosted backend without writing any storage code, one of the tools above will serve you better. MetricHouse draws no charts.
Where to go next
- Getting started builds a working counter in about twenty lines.
- How it works explains the pipeline in detail.
- Metric types compares the six things you can declare.